Hi,
I've had another go at measuring the drag reduction one might get by adding fairings to roof mounted PV panels.
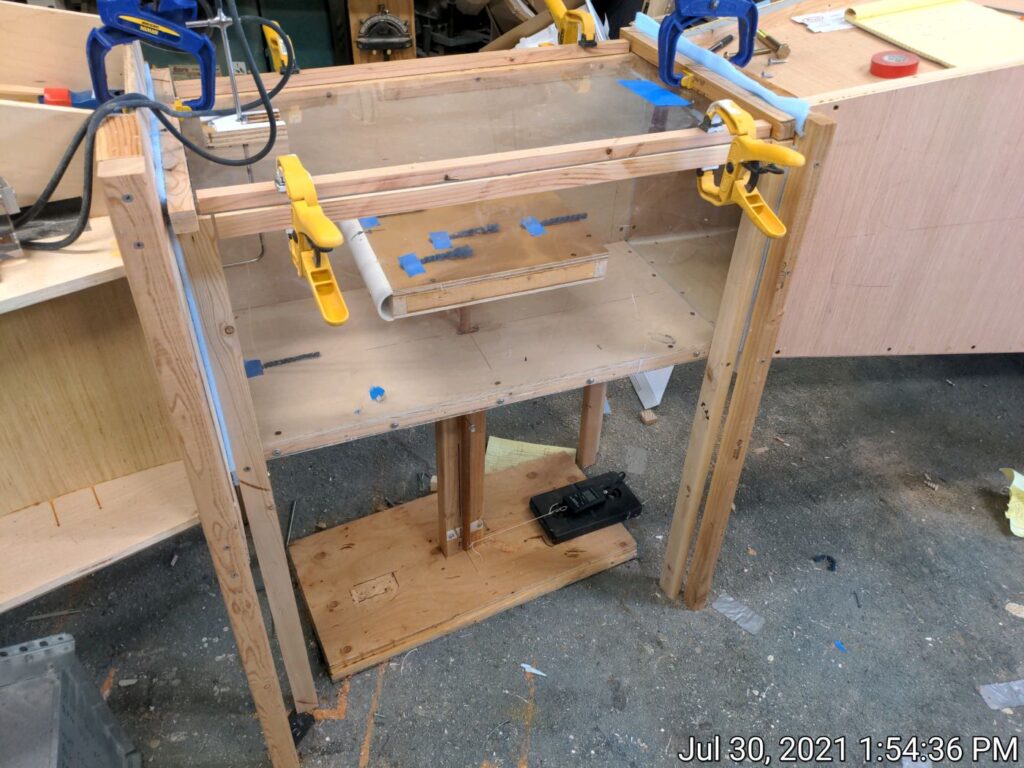
I went off the deep end a bit and built an actual wind tunnel - something I've always wanted to do
")
A detailed description of the tunnel and how it works and some validation data are
here...
Any suggestions on how to improve it are most welcome.
In a nutshell, the test section where the model goes is 13.5 by 13.5 inches. I would like it to have been a bit bigger,but the the length of the tunnel and the blower required push air through it get prohibitive pretty fast, and the 13.5 is enough to test parts of PV panels for drag. The tunnel has generally turned out well, with very consistent velocities and low turbulence in the test section. There are two not so great issues that are explained at the end of this post, and I'd like any advise anyone has on these two issues.
The model of the PV panel is 11 inches wide by 1.75 inches thick by 12 inches along the flow direction. So, the models are full scale in thickness, but smaller in area than the actual PV panel.
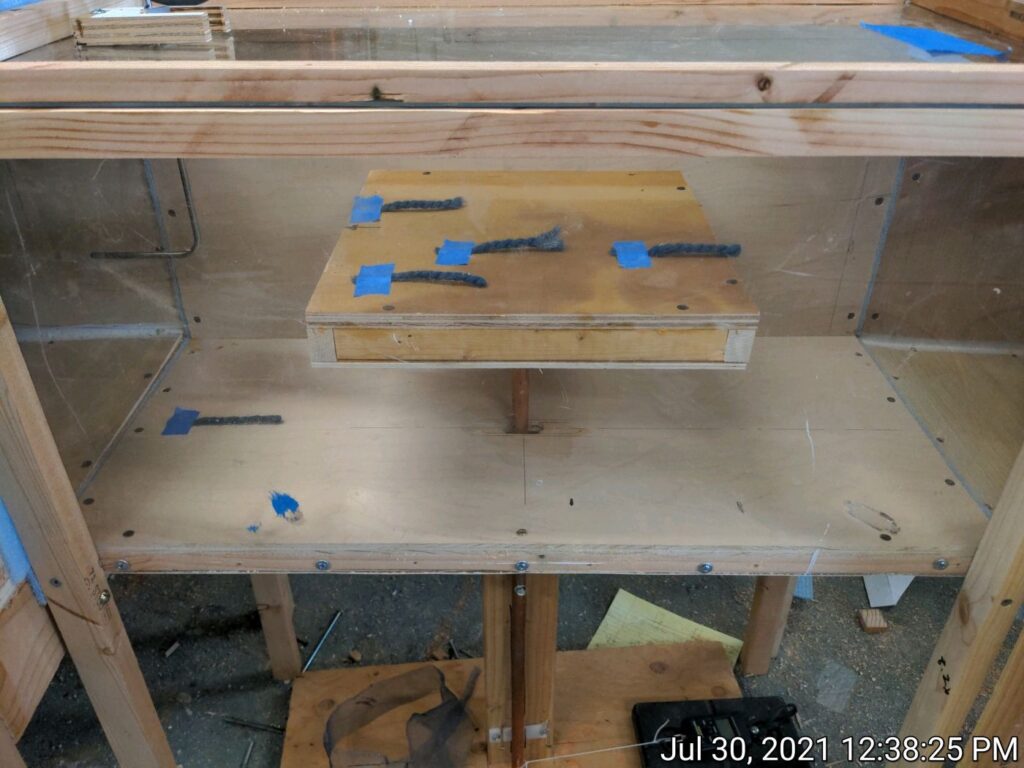
The test section with the PV panel model with no fairings "flying" in it.
The front of the model is a just a flat face (like a PV panel), but can have an elliptical fairing added to it, or a half pipe fairing applied to it.
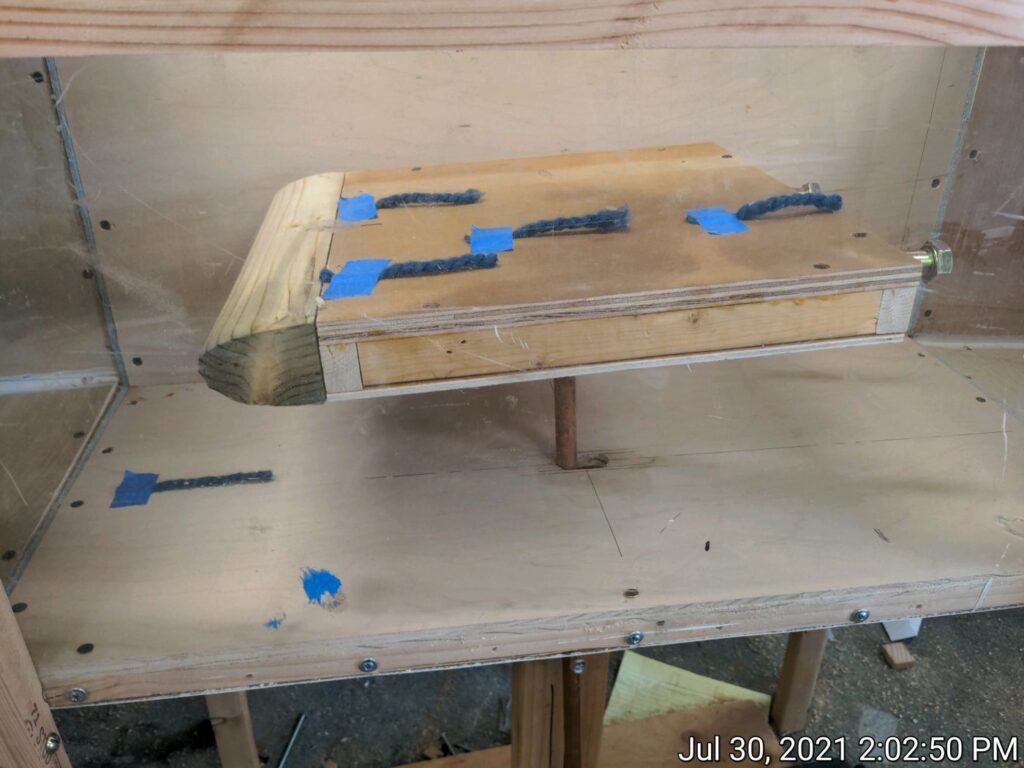
The PV panel model with the elliptical nose fairing attached.
The bottom of the panel is an open box (like a real PV panel), but a smooth bottom can be applied - this bottom replaces a spacer and adds no thickness.
The trailing edge of the test panel can have a 15 degree boat tail fairing added to it.
The picture above shows the test section with the transparet side and top - the top is easily removable to allow changing or replacing the model. The model is supported on a rod which extends through the floor of the test section. The rod is supported on a low friction pivot a bit below the floor, and the rod continues downward for an equal distance with the force being measured by a digital fish scale attached to the end of the rod. Care is taken on each reading to make sure the model balanced fore and aft and that the rod is dead vertical (model horizontal). The air velocity is measured at start and end of each run using a pitot tube and manometer.
I also attached yarn tufts to parts of the models to try to get an idea of how smooth (or not smooth) the flow was with and without the fairings. I'll put these up on Youtube, but the results a just what you would expect -- the no fairings version shows lots of separated flow from the panel nose tail. With either the elliptical nose or half pipe nose, the separation is reduced to the point where it can't be seen in the yarn tuft movement.
Here are some sample drag force measurement runs
| Nose | Bottom | Tail | Fdrag (lb) | Fdrag 70-70 (lb) | MPG change (%) | Life Gals | Life $'s |
| none | none | none | 0.83 | 21.1 | -11.1% | 1235 | $4,322 |
| elliptical | none | none | 0.38 | 9.8 | -5.2% | 573 | $2,007 |
| half pipe | none | none | 0.53 | 13.5 | -7.1% | 790 | $2,765 |
| none | yes | none | 0.55 | 14 | -7.4% | 819 | $2,867 |
| elliptical | yes | 15 deg | 0.23 | 5.9 | -3.1% | 345 | $1,208 |
| elliptical | none | 15 deg | 0.36 | 9.16 | -4.8% | 536 | $1,876 |
- First three columns show what kind of fairing was in each position (nose, bottom and tail)
- Fdrag is the force measured on the model in the windtunnel. The windtunnel speed can vary about plus/minus 1 MPH from run to run, and these are all corrected to what the force would be at 35 MPH (a small correction in all cases).
- Fdrag 70-70 is the model force scaled up from 35 MPH to 70 MPH and the panel width scaled up from 11 inches to 70 inches. This is an estimate of what the forces would be under real world conditions on an actual van. Since the drag goes up with velocity squared, going from 35 to 70 increases drag by a factor of 4.
- MPG Change (%) is an ATTEMPT to estimate how much your MPG would change from a van with no PV panel on the roof. The methods is explained below.
- Life Gals is the number of extra gallons you would use over 200K miles for a van that got 18 MPG before adding the PV panel.
- Life $'s is the cost of the added gallons over the life at an average of $3.50 per gallon.
Important to note here that the MPG and gasoline columns are relative to a van with NO PV panel installed. The saving in MPG and gas is obtained by comparing the numbers on the top line (no fairing and 11% MPG drop) to the line for the fairing you are interested in.
The MPG change is calculated by taking the Fdrag 70-70 number and multiplying it by 5280 ft per mile to get the extra energy per mile needed to push the PV panel through the air for a mile. This is then divided by an ESTIMATED vehicle powerplant efficiency of 20% to get the energy input in added gasoline per mile. This is then divided by the gasoline use at 18 MPG to get the percentage change in MPG. This is obviously very rough - so, take them with a healthy bit of skepticism - maybe someone has a better way to do this?
I guess one rough conclusion is that the savings are so large that even if the estimates are way to high, its still worthwhile doing the fairing(s).
If the 21 lbs of force on a 70 inch wide, 1.75 inch thick at 70 MPH seems unreasonably high to you, envision taping an 11 inch square piece of plywood (same frontal area as PV panel) to your hand and then sticking your arm out the window at 70 MPH with the flat face of the plywood facing into the flow -- 21 lbs does not seem so unreasonable
If's, And's and But's
A couple of caveats on the windtunnel.
I had hoped to get the tunnel velocity up to 60 MPH to get more realistic highway speeds, but my blower setup can only manage about 40 MPH max. If anyone has any ideas for moving more air through the tunnel at a reasonable price, I'm all ears.
A puzzling thing is that when I try to validate that the wind tunnel is producing good drag numbers by back calculating the drag coefficient for shapes with a known drag coefficient, the ones I calculate are substantially higher than the handbook values. If anyone has any ideas on this, please let me know.
The tunnel tests full scale models of the PV panels in a free airstream, while the panels mounted on the van roof are seeing an airstream that is influenced by the van itself. Its not clear to me what effect this might have on the results. On the one hand, the air has to accelerate to makes its way up and over the van (like the flow over the top of a wing). On the other hand, the presence of the van roof surface below the panel may have a drag reducing effect.
In any case, the free stream drag reductions that the fairings accomplish are at least a clue as to what might be achieved in the real world case, and the savings are so large that even if the real world numbers are substantially lower, the benefits would still be large.
Thinking about a test on the van with a simple, full scale, 70 inch wide PV panel model mounted up close to the front of the van and 3 or 4 inches above the roof line. The results of this should be large enough to measure on a careful A, B, A actual MPG test.
Any ideas, suggestions, comments are most welcome.
Gary